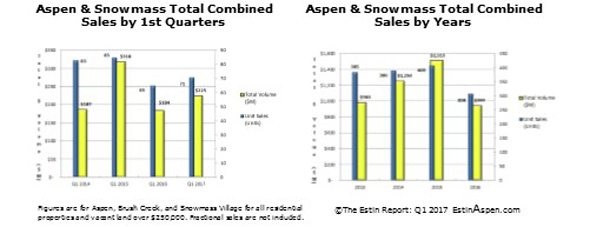
This is the 501th weekly blog post on the Estin Report !! Check out the SearchEstinAspen Section to find all kinds of info on this site. Over time, the archival content builds and becomes more useful.
The April 2017 Aspen Snowmass Real Estate Monthly Market Snapshot was posted in Current Reports on Wed. May 3rd. The Monthly Snapshots are usually posted on or near the 1st Monday of the month. The Q1 2017 & 2016 Year End report will be released this week, I hope, as will Q4 2016 stats.
An article appeared in the Denver Post Sunday Feb 26th on Colorado Mountain resort real estate including Aspen and Pitkin County.
Bottom Line: Estin Report: Apr 2017 Aspen Real Estate Market Snapshot Excerpt:
“Aspen real estate is in turn-a-round mode from a dismal 2016 when global uncertainty curtailed buyers’ appetite for luxury high end 2nd home purchases. Post-election 2016, an upper-end Aspen real estate recovery is in full bloom.
In April 2017, for the combined Aspen/Snowmass Village market, the number of units sold is up +25%, from 28 last year to 35 this year. The number of properties that went under contract in April 2017 was 30 versus 25 last year. Under contracts are viewed as an indicator of future activity.
But the surging market activity grabbing local headlines is very specific: location specific, property specific, style/design specific, property age specific… There’s inside the roundabout and there’s outside. Not everyone’s partying at present.
If you want to pay through your teeth, pour money into developer’s pockets who saw these things coming 2-4 years ago, be a part of the great migration closer into town…”
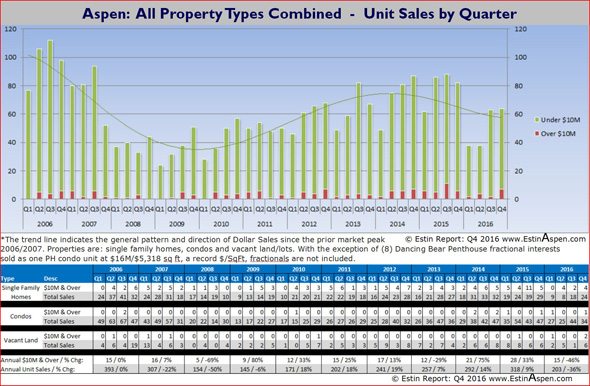
New Charts Below: Historic Pace of Aspen and Snowmass Village Homes, Condos and Vacant Land / Lots by Dollar Sales and Unit Sales Updated with Q1 2017. (These charts are very popular and will be updated every quarter):
These new charts were originally posted in Current Reports on 02/15/17 through Q4 2016. They have been updated with Q1 2017 stats. The charts are: the historic pace of dollar and unit sales since 2006 separately for Aspen and Snowmass Village (SMV) by property types: 1) all properties combined; 2) single family homes; 3) condos; 4) vacant land / lots. (Fractionals, with the exception of extreme sales, are not included.)
Sales velocity, or pace, whether by dollar volume or unit sales is extremely useful to consider ss the unit sales drop-off in the 2nd Half 2007 so foreshadowed the Great Recession.
While many real estate professionals use dollar volume sales as the single metric for sales performance (it often looks ‘better’), unit sales are a more reliable measure of market activity. Dollar sales can be skewed disproportionately by extreme high or low end priced sales.
Clients often ask, “Where are we now compared to the Great Recession…?”. These charts offer a solid reference for that conversation. In this instance, the starting point for the trend line is 2006, but, of course, where the trend line commences will affect its outcome…If the charts had started at 2009, the trend would be more upwards at present than is shown here.
As this is written, post-election Nov 2016 through Feb 15, 2017, sales have picked up considerably and are decidedly on an upward trajectory.
Click chart to see additional breakdown charts for Aspen and SMV by property types.
“Flip Job” Examples: See recent Before/After redevelopment in the new Flip Jobs Section near the bottom of the Menu Bar on the left. These are properties that have been recently or are currently in the process of redevelopment for re-sale. This post is updated (01/04/17) as additional re-sale properties come on the market at significantly higher prices.
___________
Market Activity Week 17, April 23 – 30, 2017
Aspen Snowmass real estate weekly sales and under contract activity appears below for all Aspen, Snowmass Village, Brush Cr Village, Woody Creek and Old Snowmass properties over $250,000 excluding fractionals in the upper Roaring Fork Valley. As the MLS links below expire after 30 days, photos and written descriptions of select closed properties (those with excellent photography) are posted here to preserve an archive of sold market activity. Scroll down the page for home photos and details of weekly sales and under contract / pending Aspen properties in the past 4 weeks. For earlier dates, use the down arrow to quickly find blog archives by year and date to 2008. Or use SearchEstinAspen in the menu bar to search by topic, address, subdivision, complex, date, etc. If it’s about Aspen real estate, the information should be here.
Closed (11): MLS#s 142373, 140442, 136466, 139230, 143520, 144612, 145372, 145843, 146882, 147536, 148658. This link is valid until 5/30/2017.
Under Contract/Pending (6): MLS#s 138827, 144655, 144945, 146806, 147382, 148592. This link is valid until 5/30/2017.
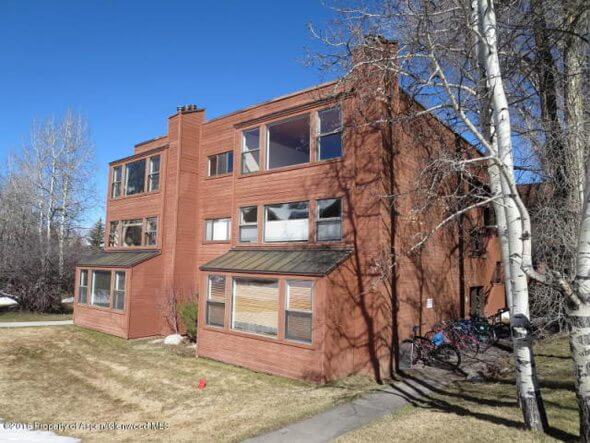
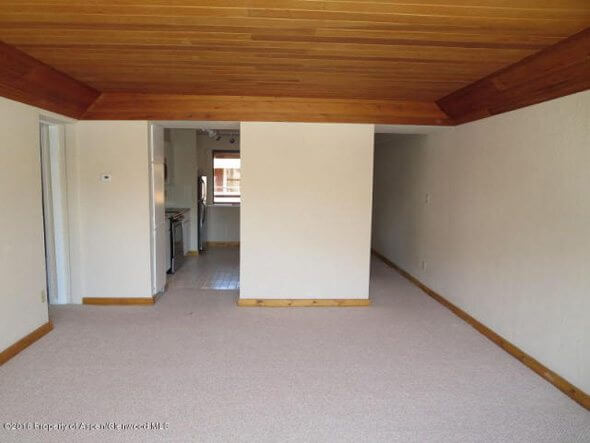
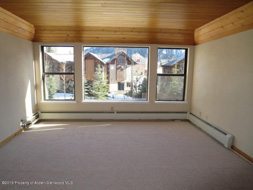
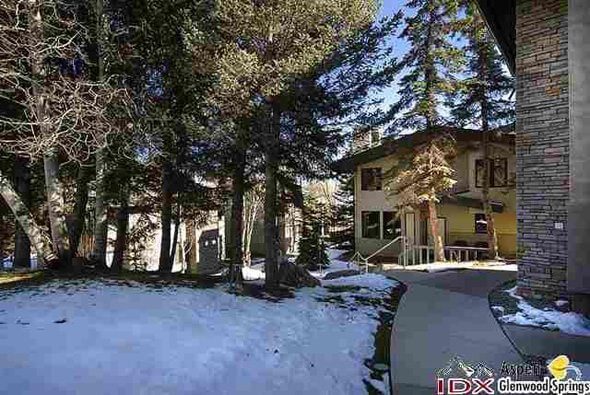
Aspen Snowmass Solds Last Week:







Recent Estin Report tweets on Aspen Real Estate
{loadposition articlepos}
Disclaimer: The statements made in The Estin Report and on Aspen broker Tim Estin’s blog represent the opinions of the author and should not be relied upon exclusively to make real estate decisions. A potential buyer and/or seller is advised to make an independent investigation of the market and of each property before deciding to purchase or to sell. To the extent the statements made herein report facts or conclusions taken from other sources, the information is believed by the author to be reliable, however, the author makes no guarantee concerning the accuracy of the facts and conclusions reported herein. Information concerning particular real estate opportunities can be requested from Tim Estin at 970.309.6163 or by email. The Estin Report is copyrighted 2017 and all rights reserved. Use is permitted subject to the following attribution with a live link to this website: “The Estin Report on Aspen Real Estate.”
____________________________________________________________________________________

