Bottom Line
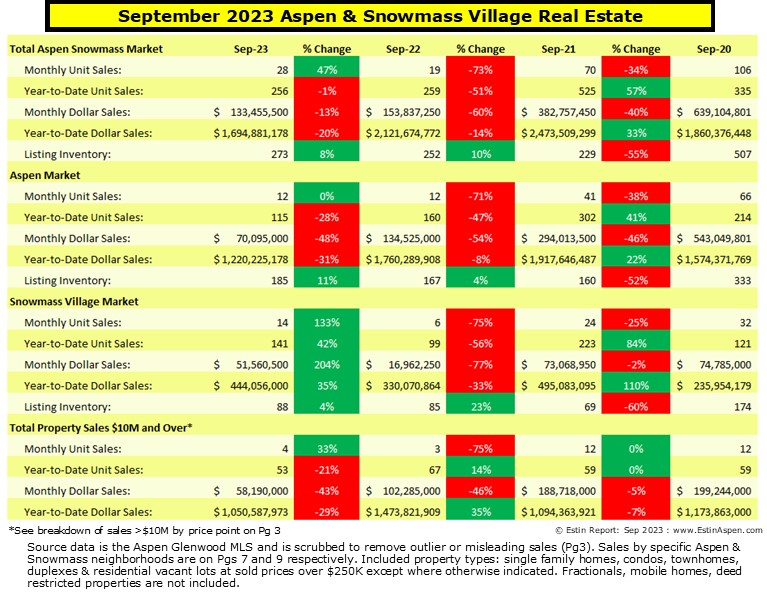
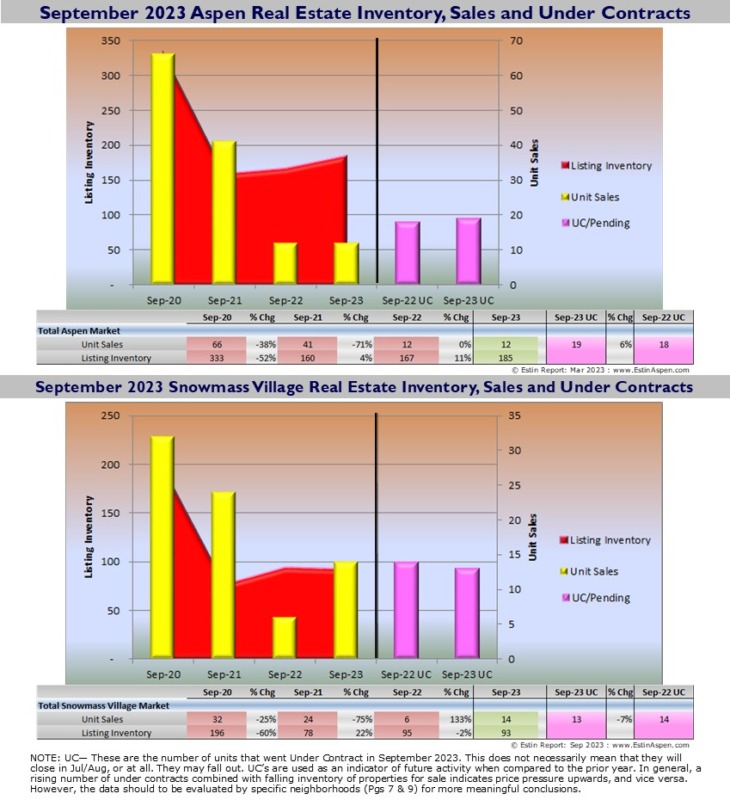
The market continues to be at near record low inventory and sellers continue to maintain control although lessor so than a year ago. For the past 3 months July through September 2023, sold prices to ask have declined from 99-97% a year ago to 96-93% this year in the $10-20M range by far the largest segment of the Aspen single family home market (See Pg 3 Sep 2023) . Even though inventory of properties for sale has increased incrementally in the past year, the continued reality of high prices with fewer choices turns buyers away – with many thinking the market will adjust even more downward with patience.
Some reasons why?
-Even though approximately 70% of Aspen property deals are in cash, higher interest rates are negatively influencing buyer’s large purchase decisions.
-While inventory of properties for sale has increased incrementally in the past year, the continued reality of high prices with fewer choices turns buyers away with many thinking the market will adjust even more downward with patience.
-Sellers are stuck – with prices so high and low inventory, sellers as well have fewer buying options – where are they to go and they’ll have to pay at least double for what they have already. They’ll get less product at a greater cost with little selection options so why move?
Click images to enlarge.
Click images to enlarge.
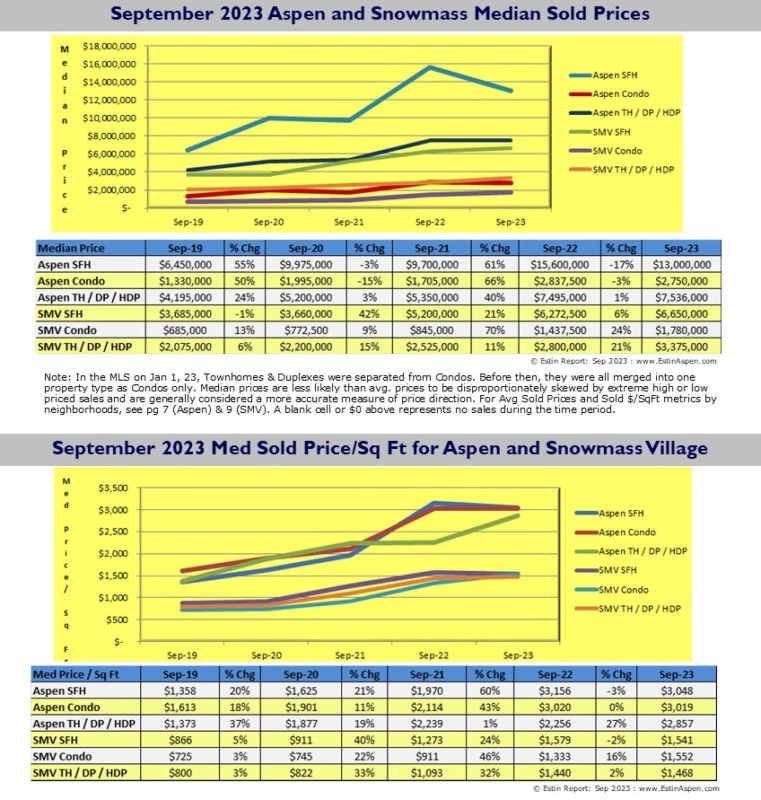
AUG 2023 – ASPEN AND SNOWMASS VILLAGE: MEDIAN PRICES AND MEDIAN SOLD PRICES PER SQ FT
Click images to enlarge.
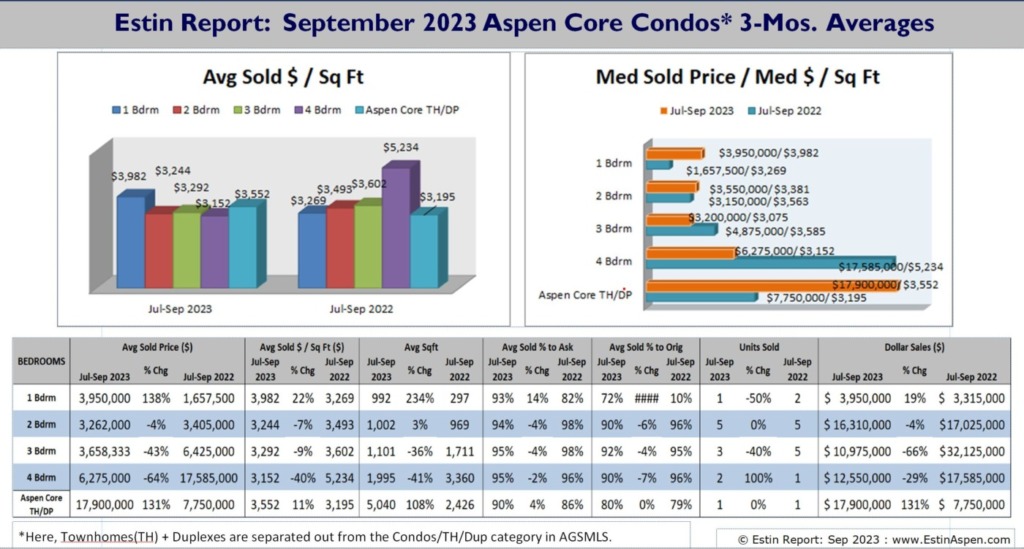
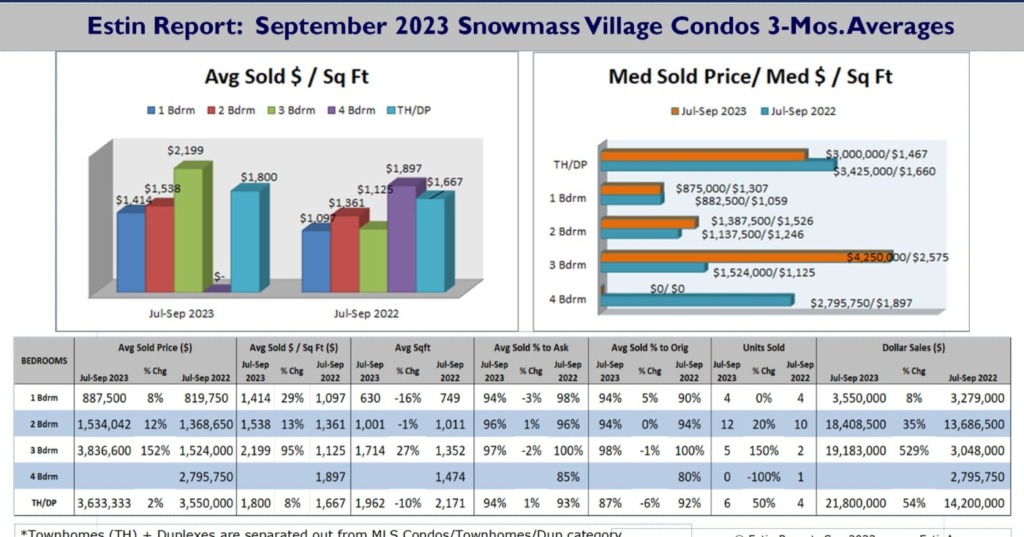
ASPEN AND SNOWMASS VILLAGE: CONDO SALES BY BEDROOMS
(SEE REPORT Pgs 7 & 9 FOR SINGLE FAMILY HOME DATA)
ASPEN
Click images to enlarge
SNOWMASS VILLAGE
Click images to enlarge
Links to Aug 23 Aspen and Snowmass Village Sold Property Photos and Details:
Aspen Sep 23 Closed Properties.
Snowmass Village Sep 23 Closed Properties.
Vacant Lots Sep23 Closed Properties.
Released Oct 16, 23 v1.5
The Estin Report posts a 10-page monthly Aspen real estate market report “Snapshot” on or near the 1st Monday of each month. The Snapshot presents a “bottom line” summary and raw data of the subject month and YTD performance for residential real estate sales in Aspen and Snowmass today. It includes on and off-market sales and scrubbed data to remove “outliers” to present the most accurate and relevant data available. There are (3) sections: 1) Total combined Aspen Snowmass Village Market; 2) The Aspen Market; 3) The Snowmass Village Market. It features charts, tables and 30-day live links to photos and details of sold properties and compares the subject month to the same time in prior years. The Monthly Snapshot is the only Aspen and Snowmass property sales information widely published in a timely and consistent manner early each month. This information is deemed reliable but cannot be guaranteed.
The Estin Report© is copyrighted 2023 and all rights reserved.
Use is permitted subject to the following attribution with a live link to the source: Estin Report on the Aspen real estate market


