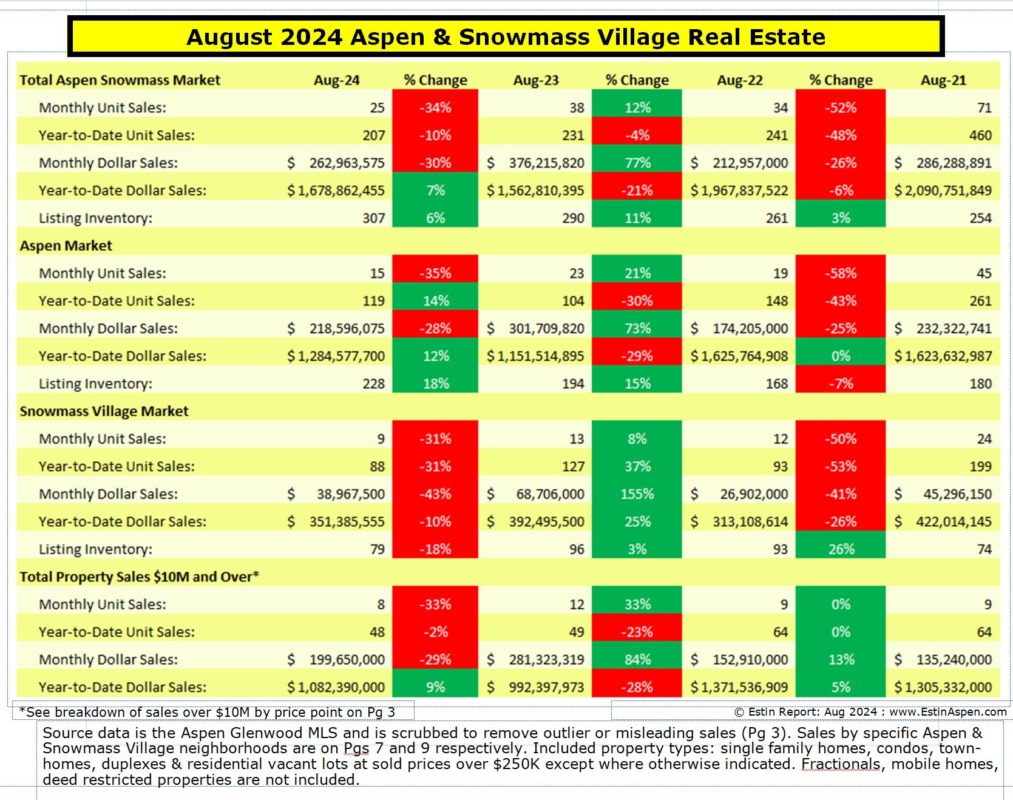
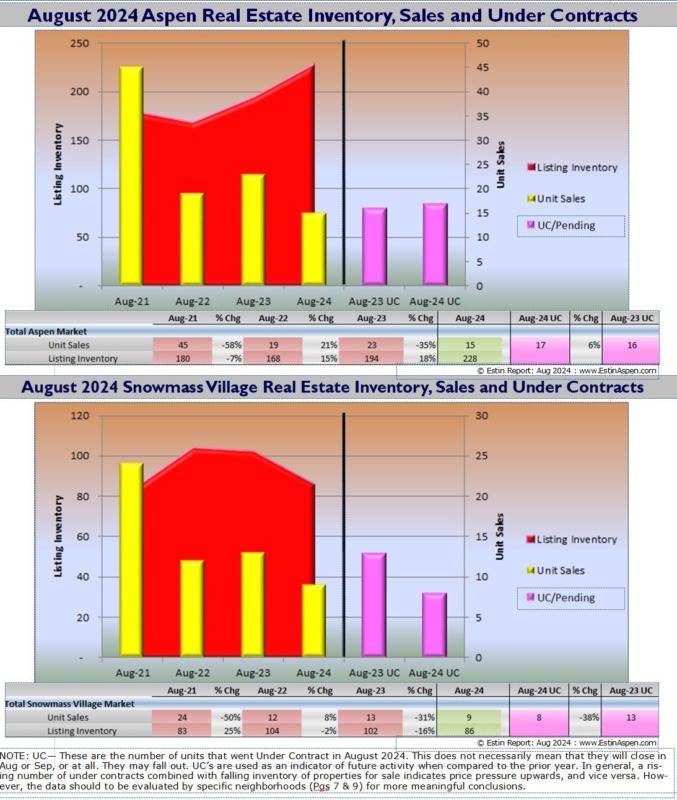
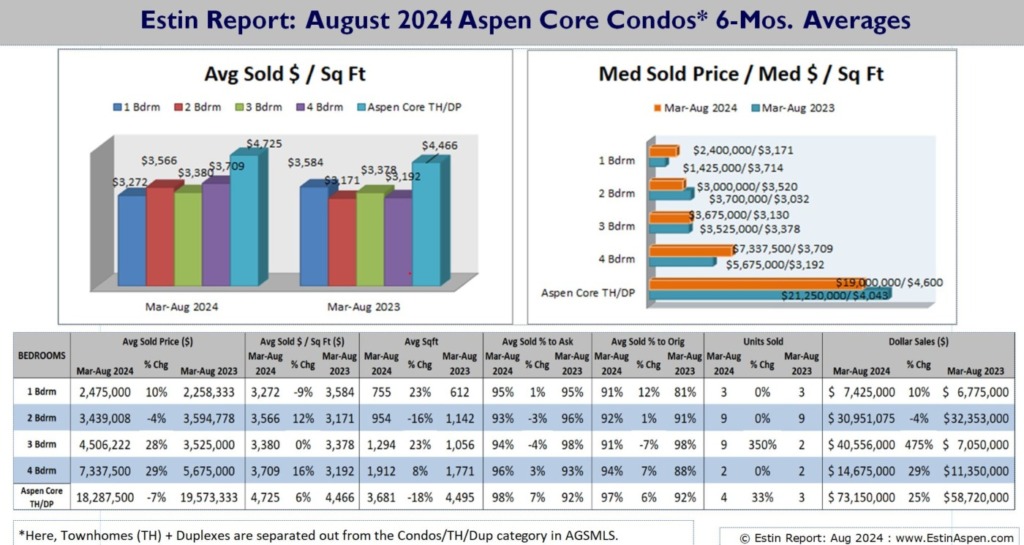
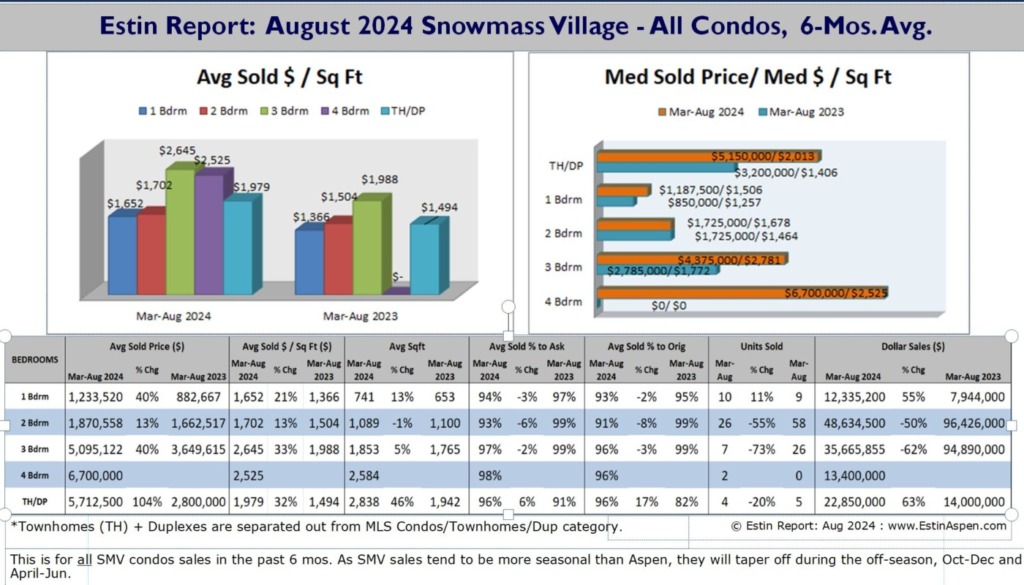
v2.0 The Estin Report publishes a 10-page monthly Aspen real estate market “Snapshot” on or near the 1st Monday of each month. The Snapshot presents a “bottom line” summary and raw sales data of the subject month and YTD performance for residential real estate sales in Aspen and Snowmass. There are three sections: 1) Total combined Aspen Snowmass Village Market; 2) The Aspen Market; 3) The Snowmass Village Market. It features charts, tables and 30-day live links to photos and details of sold properties and compares the subject month to the same time in prior years. The Monthly Snapshot is the only Aspen and Snowmass property sales information widely published in a timely and consistent manner early each month.
BOTTOM LINE
In conversations with a number of brokers, there’s a general consensus at the tail end of summer that original list prices of properties for sale, out of the gate, are priced up to 10-15% above their most recent comps. Is that a fair statement? I investigated Aspen single family homes sold under $30M over the summer – June through August – comparing them with the past 3 yrs. The results:
Aspen Single Family Home Sales Under $30M
Jun 1-Aug 31, 24 Asp SFH = 11 sales
|
Sold%OfAsk$ |
Sold%OfOrig$ |
Sold Price Per/SF |
Sold Price |
Price/LvH SqFt |
Asking Price |
Original List Price |
|
-8% |
-15% |
|
$ 135,642,000 |
|
$ 148,055,000.00 |
$ 159,155,000 |
Jun 1-Aug 31, 23 Asp SFH = 20 sales
|
Sold%OfAsk$ |
Sold%OfOrig$ |
Sold Price Per/SF |
Sold Price |
Price/LvH SqFt |
Asking Price |
Original List Price |
|
-9% |
-16% |
|
$ 273,630,800 |
|
$ 300,985,300 |
$ 326,435,300 |
Jun 1-Aug 31, 22 Asp SFH = 10 sales
|
Sold%OfAsk$ |
Sold%OfOrig$ |
Sold Price Per/SF |
Sold Price |
Price/LvH SqFt |
Asking Price |
Original List Price |
|
-4% |
-5% |
|
$ 117,864,000 |
|
$ 122,774,000 |
$ 124,069,000 |
Conclusion:
In summer 2022 coming out of the Pandemic, Aspen single family home properties were priced much closer to market than they are at now. At present, many properties are priced let’s say “aspirationally”, at 15% above the comps. As mentioned in prior recent reports, properties are generally selling at 5-10% off ask.
Election Effect?
I’m asked frequently how Presidential elections affect our market. In my H1 2024 report, the past three election year cycles reveal somewhat of a trend albeit weak: a rise in activity leading up to the election, some flattening as we close in on election day, followed by either more flattening or a decline into the new presidential year (H1 2024, Pg 15 & 24).
Select charts and tables from the July 2024 report
Aug 2024: Aspen & Snowmass Village Single Family Homes Median Prices for Apr, May, Jun (Pg 4 top)
Aug 2024: Aspen & Snowmass Village Single Family Homes Median Prices per Sq Ft for Apr, May, Jun (Pg4 bottom)
Aug 2024, Pg 1 Summary
Aug 2024, Pg 2
Aug 2024, Pg 7 top
Aug 2024, Pg 9 top
Links to Aug 24 Aspen and Snowmass Village Sold Property Photos and Details:
Aspen Aug 24 Closed Properties.
Snowmass Village Aug 24 Closed Properties.
___________


