Posted 07.04.21 v1.51

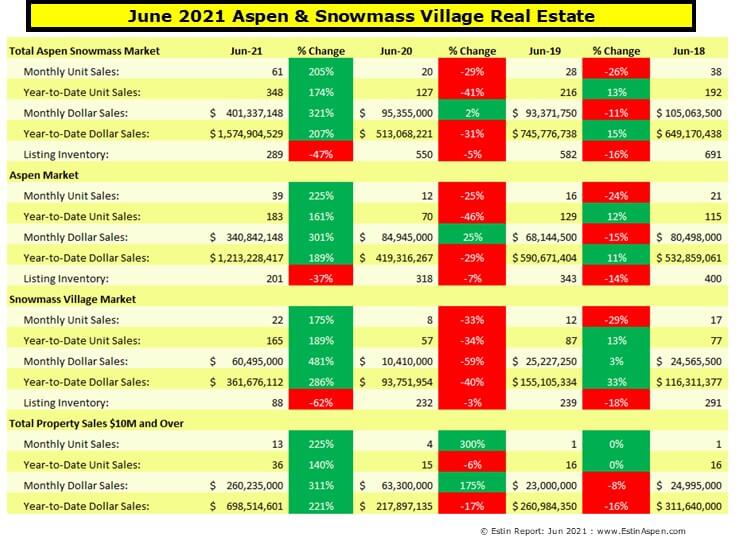
Pg 1 Summary. The 2021 Year-Over-Year (YOY) comparison is meaningless due to the Covid shutdown a year ago. Better is a YOY comparison to 2019 and 2018. Even so, the current increase in sales activity in 2020-2021 has been staggering.

Bottom Line: With a record single family home sale at $72.5M/$3,235 sq ft in June, the Aspen real estate market has gone beyond beyond. Yes, it’s always been at least a bit beyond. Now, it’s certifiable. Yet most major indexes are at record highs, or, like mortgage rates, at historically low levels. Records— high/low—everywhere. In Knight-Frank’s 2021 Wealth Report, the pandemic related growth in real estate demand—and especially for open space, the natural environment with technology/connectivity, flight access and community—are driving this. Aspen delivers on all of these. In Jun ’21, (13) out of (27) June Aspen single family home sales were over $10M: (6) of these were over $15M and (10) were sold at between $2,000-$3,400 per sq ft. For perspective, we still have room to go…According to Elite Traveler, the most expensive world property markets are: Monaco $5,263 sq ft, Hong Kong $4,393 sq ft, New York a steal at $2,466 sq ft and London merely $1,891 sq ft.
Aspen and Snowmass Village Real Estate – Key Market Metrics
H1 2021: Jan 1 – June 30, 2021 (Pgs 4, 7 & 9 referenced)
Aspen Prices and Top Selling Neighborhoods
- Aspen median sold price single family home $9.7M
- Aspen median sold price condo $1.8M
#1. Central Core = 71 sales
- Avg sold condo/townhome: $2.6M/$2,101 sq ft
- Avg sold 2 bdrm condo: $1.75M/1,880 sq ft
- Avg sold 3 bdrm condo $3.25M/$2,285 sq ft
- Avg sold townhome $6.82M/$2,648 sq ft
#2 West Aspen = 22 sales
- Avg sold single family home $14M/$1,828 sq ft
#3 Red Mountain = 11 sales
- Avg sold single family home $22.3M/$2,650 sq ft
#3 Historic West End
- Avg sold single family home $9.2M/$2,292 sq ft
Snowmass Village Prices and Top Selling Neighborhoods
- Snowmass Village median sold price single family home $5.1M
- Snowmass Village median sold price condo $805K
#1 Snowmass Village Condos = 115 sales
- Avg sold 2 bdrm condo: $884K/$782 sq ft
- Avg sold 3 bdrm condo $1.92M/$1,103 sq ft
#2 Woodrun = 9 sales (Best ski in/out)
- Avg sold single family home $6.7M/$1,449 sq ft
#3 Ridge Run = 8 sales (Mix of ski in/out and non ski in/out)
- Avg sold single family home $3.6M/$955 sq ft
#4 Horse Ranch = 5 sales (No ski in/out. Best views.)
- Avg sold single family home $4.7M/$1,148 sq ft
Aspen Only: June 2021 Market Statistics Summary
Aspen condo sales June 2021
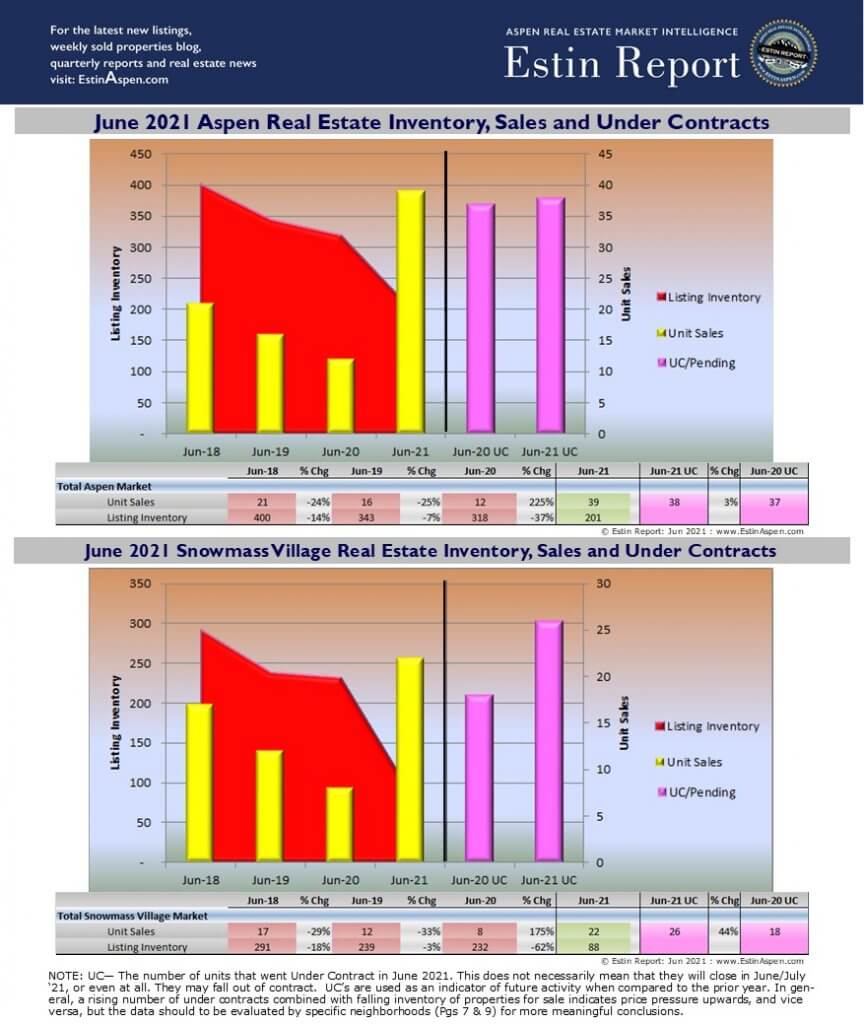
- Unit Sales: +167% (16) in June ‘21 vs (6) in June ‘20 vs –25% (8) in June ‘19 vs –33% (12) in June ‘18
- Dollar Sales: +31% $34M in June ‘21 vs $26M in June ‘20 vs +31% ($20M) in June ‘19 vs –25% ($27M) in June ‘18
- Inventory Active Listings: -28% (93) in June ‘21 vs (129) in June ‘20 vs +0% (129) in June ‘19 vs –19% (159) in June ‘18
Aspen condo sales YTD
- Unit Sales: +159% (101) in June ‘21 vs (39) in June ‘20 vs –25% (8) in June ‘19 vs –33% (12) in June ‘18
- Dollar Sales: +42% $250M in June ‘21 vs $176M in June ‘20 vs +7% ($164M) in June ‘19 vs –18% ($201M) in June ‘18
- Inventory Active Listings: +21% (223) in June ‘21 vs (184) in June ‘20 vs -16% (220) in June ‘19 vs –1% (223) in June ‘18
Aspen Single family home sales June 2021
- Unit Sales: +233% (20) in June ‘21 vs (6) in June ‘20 vs –0% (6) in June ‘19 vs –25% (8) in June ‘18
- Dollar Sales: +394% $291M in June ‘21 vs $59M in June ‘20 vs +30% ($45M) in June ‘19vs -2% ($46M) in June ‘18
- Inventory Active Listings: -42% (91) in June ‘21 vs (157) in June ‘20 vs –7% (169) in June ‘19vs –9% (186) in June ‘18
Aspen Single family home sales YTD
- Unit Sales: +170% (73) in June ‘21 vs (27) in June ‘20 vs –33% (40) in June ‘19vs –7% (43) in June ‘18
- Dollar Sales: +291% $916M in June ‘21 vs $234M in June ‘20 vs –33% ($349M) in June ‘19 vs +17% ($300M) in June ‘18
- Inventory Active Listings: -13% (186) in June ‘21 vs (216) in vs –9% (258) in June ‘19 vs –7% (253) in June ‘18
*Typically, the Aspen market represents 70-75% of the total combined Aspen Snowmass Village real estate marketplace.
Snowmass Village Only: June 2021 Market Statistics Summary
Snowmass Village condo sales June 2021
- Unit Sales: +133% (14) in June ‘21 vs (6) in June ‘20 vs –14% (7) in June ‘19 vs –46% (13) in June ‘18
- Dollar Sales: +137% $13M in June ‘21 vs $5M in June ‘20 vs –42% ($9M) in June ‘19 vs –33% ($14M) in June ‘18
- Inventory Active Listings: -61% (63) in June ‘21 vs (162) in June ‘20 vs +8% (150) in June ‘19 vs –19% (186) in June ‘18
Snowmass Village condo sales YTD
- Unit Sales: +167% (128) in June ‘21 vs (48) in June ‘20 vs –26% (65) in June ‘19 vs +23% (53) in June ‘18
- Dollar Sales: +153% $165M in June ‘21 vs $65M in June ‘20 vs –5% ($9M) in June ‘19 vs –33% ($43M) in June ‘18
- Inventory Active Listings: +0% (235) in June ‘21 vs (233) in June ‘20 vs –7% (234) in June ‘19 vs –5% (274) in June ‘18
Snowmass Village Single family home sales June 2021
- Unit Sales: +250% (7) in June ‘21 vs (2) in June ‘20 vs –60% (5) in June ‘19 vs +25% (4) in June ‘18
- Dollar Sales: +742% $42M in June ‘21 vs $5M in June ‘20 vs –69% ($16M) in June ‘19 vs +49% ($11M) in June ‘18
- Inventory Active Listings: -63% (23) in June ‘21 vs (63) in June ‘20 vs –17% (76) in June ‘19 vs –16% (91) in June ‘18
Snowmass Village Single family home sales YTD
- Unit Sales: +325% (34) in June ‘21 vs (8) in June ‘20 vs –60% (20) in June ‘19 vs –17% (24) in June ‘18
- Dollar Sales: +679% $185M in June ‘21 vs $24M in June ‘20 vs –72% ($81M) in June ‘19 vs +15% ($74M) in June ‘18
- Inventory Active Listings: -31% (65) in June ‘21 vs (95) in June ‘20 vs –23% (124) in June ‘19 vs –3% (128) in June ‘18
* Typically, the Snowmass Village market represents 25-30% of the total combined Aspen Snowmass Village real estate marketplace.
Links to June 2021 Aspen and Snowmass Village Sold Property Photos and Details:
Aspen June 2021 Closed Properties. This link is valid until 8/1/21.
Snowmass Village June 2021 Closed Properties. This link is valid until 8/1/21.
Vacant Lots June 2021 Closed Properties. This link is valid until 8/1/21.
____________


