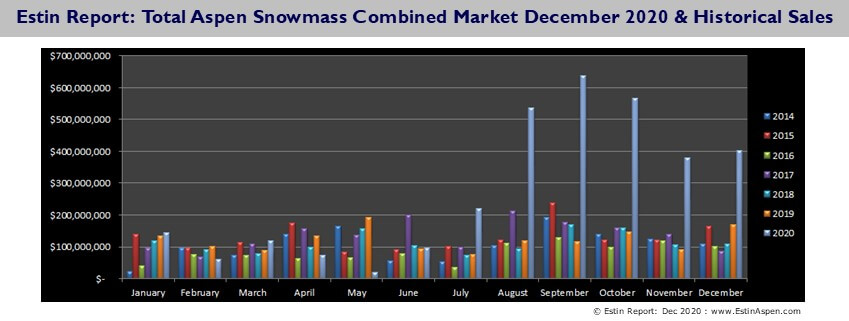
Data collected 12.31.20 after 6PM MT. Released 01.01.21 v1.5


BOTTOM LINE: The annual Estin Report is in process to be released early Jan.
The actual 10-Pg Dec 2020 Market Report Snapshot will be posted late in the day Jan 1.
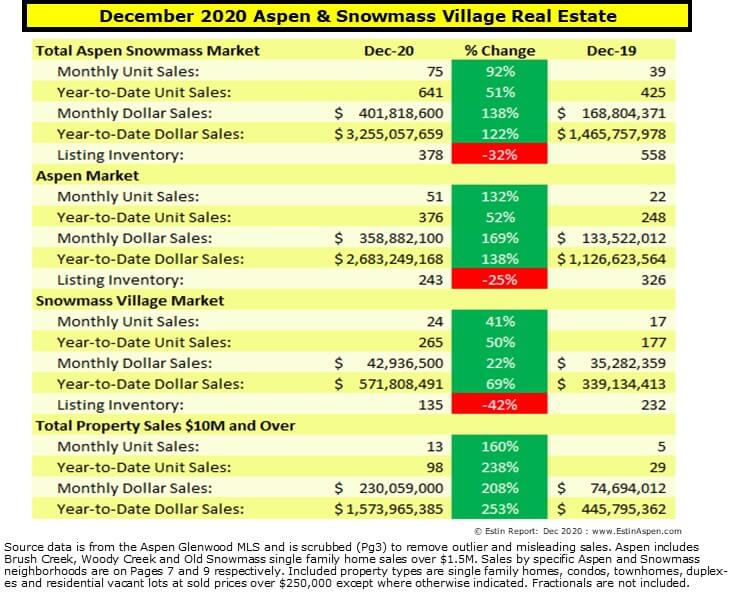
Posted here is a brief summary.
For Aspen real estate market comments, see recent article for Private Air Magazine Jan/Feb 2021 issue.
Aspen Only: December 2020 Market Statistics Summary
Aspen condo sales December 2020
- Unit Sales: +83% (22) in Dec ‘20 from (12) in Dec ‘19
- Dollar Sales: +28% $75M in Dec ‘20 from $58M in Dec ‘19
- Inventory Active Listings: -12% (106) in Dec ‘20 from (120) in Dec ‘19
Aspen condo sales YTD
- Unit Sales: +31% (180) in Dec ‘20 from (137) in Dec ‘19
- Dollar Sales: +108% $687M in Dec ‘20 from $330M in Dec ‘19
- Inventory Active Listings: +20% (366) in Dec ‘20 from (303) in Dec ‘19
Aspen Single family home sales December 2020
- Unit Sales: +211% (28) in Dec ‘20 from (9) in Dec ‘19
- Dollar Sales: +288% $284M in Dec ‘20 from $73M in Dec ‘19
- Inventory Active Listings: -28% (113) in Dec ‘20 from (156) in Dec ‘19
Aspen Single family home sales YTD
- Unit Sales: +111% (179) in Dec ‘20 from (85) in Dec ‘19
- Dollar Sales: +178% $1,897M in Dec ‘20 from $681M in Dec ‘19
- Inventory Active Listings: +15% (369) in Dec ‘20 from (319) in Dec ‘19
*Typically, the Aspen market represents 70-75% of the total combined Aspen Snowmass Village real estate marketplace. The following Aspen Dec 2020 sales are not included in these breakdowns: fractionals, mobile homes, affordable housing They have been counted in total dollar and unit sales but are not considered in other metrics within this report.
Snowmass Village Only: December 2020 Market Statistics Summary
Snowmass Village condo sales December 2020
- Unit Sales: +120% (22) in Dec ‘20 from (10) in Dec ‘19
- Dollar Sales: +167% $37M in Dec ‘20 from $14M in Dec ‘19
- Inventory Active Listings: -36% (97) in Dec ‘20 from (151) in Dec ‘19
Snowmass Village condo sales YTD
- Unit Sales: +49% (188) in Dec ‘20 from (126) in Dec ‘19
- Dollar Sales: +97% $274M in Dec ‘20 from $139M in Dec ‘19
- Inventory Active Listings: +2% (357) in Dec ‘20 from (349) in Dec ‘19
Snowmass Village Single family home sales December 2020
- Unit Sales: -71% (2) in Dec ‘20 from (7) in Dec ‘19
- Dollar Sales: -73% $6M in Dec ‘20 from $21M in Dec ‘19
- Inventory Active Listings: -54% (34) in Dec ‘20 from (74) in Dec ‘19
Snowmass Village Single family home sales YTD
- Unit Sales: +50% (72) in Dec ‘20 from (48) in Dec ‘19
- Dollar Sales: +47% $288M in Dec ‘20 from $196M in Dec ‘19
- Inventory Active Listings: -9% (146) in Dec ‘20 from (161) in Dec ‘19
* Typically, the Snowmass Village market represents 25-30% of the total combined Aspen Snowmass Village real estate marketplace. The following Snowmass Village Dec 2020 sales are not included in these breakdowns: fractionals, mobile homes, affordable housing They have been counted in total dollar and unit sales but are not considered in other metrics within this report.
Links to Dec 2020 Aspen and Snowmass Village Sold Property Photos and Details
Aspen Dec 2020 Closed Properties. This link is valid until 1/31/2021.
Snowmass Village Dec 2020 Closed Properties. This link is valid until 1/31/2021.
Vacant Lots Dec 2020 Closed Properties. This link is valid until 1/31/2021.


