Released Sep 3, 2020 v1.75

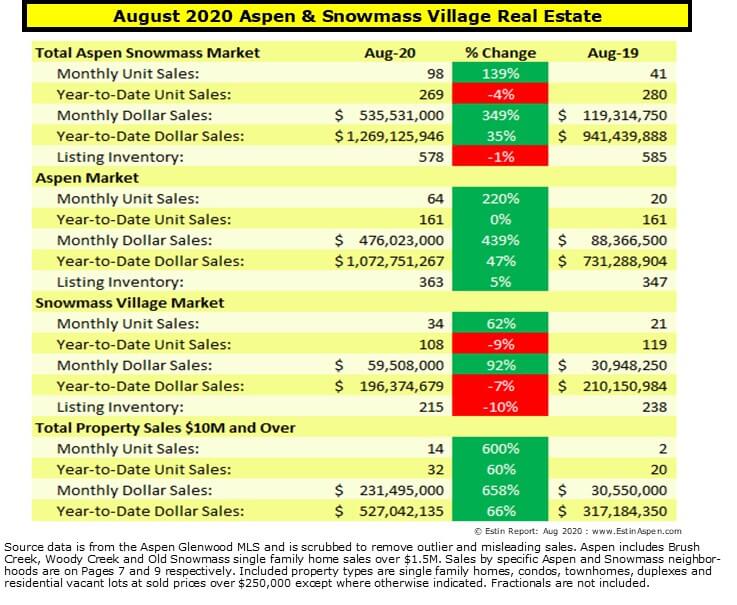
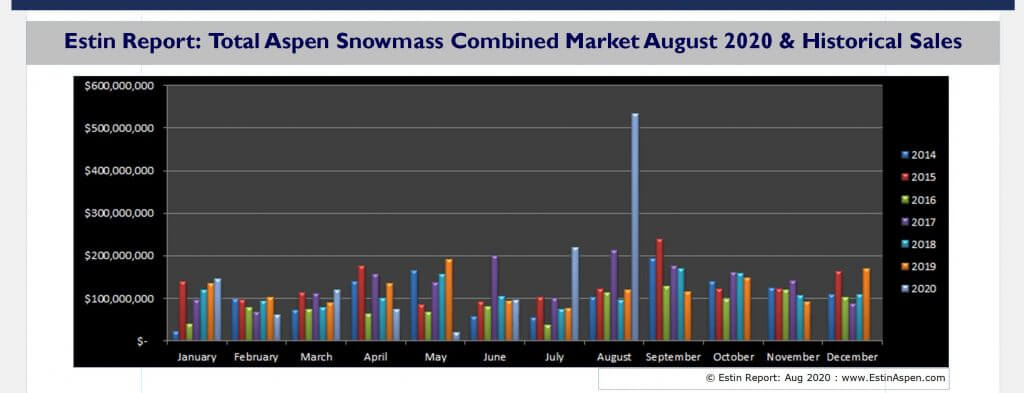
Bottom Aug 2020 Market Snapshot: It’s early Sept. and activity has slowed slightly with a number of summer visitors headed home for school and fall beginnings. But the Aspen real estate market continues at a high pitch. Besides the dramatic spiking charts and tables in this market summary, further evidence is in the following: The online real estate contract writing program CTM slowed to a dead server crawl in the past two weeks significantly delaying the writing of contracts while their tech-help department took 1-1.5 hrs to answer panicked calls; Our local MLS listing and property search system had similar server delays and a creeping pulse. Inventory of well-priced properties is so scarce that when such an unheard of listing appears, buyers pounce with multiple offers. And there are multiple offers on properties that have languished on market for years. If you are serious about Aspen or Snowmass real estate, you must act now, secure the property – lock it up – and do the heavy thinking during due diligence.

Estin Report_Aug 2020 YTD Aspen Snowmass Real Estate Mos Snapshot Historical Sales Market Report_pg5
Aspen Only: Aug 2020 Market Statistics Summary
Aspen condo sales August 2020
- Unit Sales: +160% (26) in Aug ‘20 from (10) in Aug ‘19
- Dollar Sales: +283% $80M in Aug ‘20 from $21M in Aug ‘19
- Inventory Active Listings: +29% (153) in Aug ‘20 from (119) in Aug ‘19
Aspen condo sales YTD
- Unit Sales: -11% (80) in Aug ‘20 from (90) in Aug ‘19
- Dollar Sales: +55% $306M in Aug ‘20 from $197M in Aug ‘19
- Inventory Active Listings: +11% (273) in Aug ‘20 from (244) in Aug ‘19
Aspen Single family home sales August 2020
- Unit Sales: +289% (35) in Aug ‘20 from (9) in Aug ‘19
- Dollar Sales: +440% $362M in Aug ‘20 from $67M in Aug ‘19
- Inventory Active Listings: -6% (170) in Aug ‘20 from (180) in Aug ‘19
Aspen Single family home sales YTD
- Unit Sales: +45% (74) in Aug ‘20 from (51) in Aug ‘19
- Dollar Sales: +64% $724M in Aug ‘20 from $442M in Aug ‘19
- Inventory Active Listings: +13% (304) in Aug ‘20 from (268) in Aug ‘19
*Typically, the Aspen market represents 70-75% of the total combined Aspen Snowmass Village real estate marketplace. Aspen: In Apr 2020, there were (2) Aspen outliers not counted in individual property type metrics due to their non-free market status but included in total sales metrics:
MLS# Outliers:
161848 C HunterCrk Condo 1232 Vine
147634 C HunterCrk Condo 216 Vine
Snowmass Village Only: Aug 2020 Market Statistics Summary
Snowmass Village condo sales August 2020
- Unit Sales: +38% (22) in Aug ‘20 from (16) in Aug ‘19
- Dollar Sales: +79% $26M in Aug ‘20 from $15M in Aug ‘19
- Inventory Active Listings: -12% (137) in Aug ‘20 from (155) in Aug ‘19
Snowmass Village condo sales YTD
- Unit Sales: -7% (79) in Aug ‘20 from (85) in Aug ‘19
- Dollar Sales: +18% $102M in Aug ‘20 from $86M in Aug ‘19
- Inventory Active Listings: -6% (275) in Aug ‘20 from (293) in Aug ‘19
Snowmass Village Single family home sales August 2020
- Unit Sales: +120% (11) in Aug ‘20 from (5) in Aug ‘19
- Dollar Sales: +93% $31M in Aug ‘20 from $16M in Aug ‘19
- Inventory Active Listings: -3% (70) in Aug ‘20 from (72) in Aug ‘19
Snowmass Village Single family home sales YTD
- Unit Sales: -19% (26) in Aug ‘20 from (32) in Aug ‘19
- Dollar Sales: -28% $87M in Aug ‘20 from $121M in Aug ‘19
- Inventory Active Listings: -6% (127) in Aug ‘20 from (136) in Aug ‘19
* Typically, the Snowmass Village market represents 25-30% of the total combined Aspen Snowmass Village real estate marketplace.
Links to Aug 2020 Aspen and Snowmass Village Sold Property Photos and Details
Aspen Aug 2020 Closed Properties (61). This link is valid until 9/31/2020.
Snowmass Village Aug 2020 Closed Properties (33). This link is valid until 9/31/2020.
Vacant Lots Aug 2020 Closed Properties (4). This link is valid until 9/31/2020.
____________________


