Released Aug 8, 2018 v1.5
Click image to enlarge
Bottom Line
July ’18 was significantly off from a year ago.
The market is slowing…Prices are very high – is this discouraging buyers? Is low inventory discouraging buyers? (See Pg 6: July Condo/Townhomes sales are -40% in unit and dollar sales in July; SF Homes sales are down 38%.)
Was this the impact/result of the Lake Christine fire during the month of July? A lot of planes were diverted away from Aspen and did not make it in.
It’s just one month.
However, the Condo/Townhome 3-Mos avg unit sales in the Core were down -39%, (22) in May thru July 18 vs (36) in May thru July 17 (See pg 7 – What areas are selling – 3 month Avg).
There are 2 Aspen real estate markets at present, and since our real recovery confirmed itself in spring 2014:
#1. Aspen Core, West End and Red Mountain
#2. Everyone else. There are good solid buys, if not Aspen property deals, in market #2.
There are many listings on market #1 at “dreamer” ask prices without real sold comparables. However, of these properties, the next sale of one of these – if there is one – will become the newest comp. It only takes one.
Clients ask what these will sell for…? We won’t know until there is a sold. And the discount sale price to ask price is an unknown at present.
Unless the market slows dramatically or turns downward.
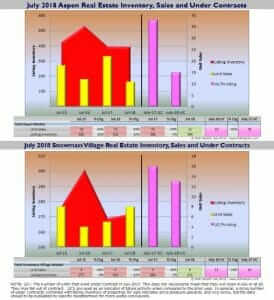
July 2018 Market Statistics Summary for Aspen Only *
Aspen condo sales July 2018
- Unit Sales: -40% (6) in July ‘18 from (10) in July ‘17
- Dollar Sales: -40% $10M in July ‘18 from $16M in July ‘17
- Inventory Active Listings: -6% (153) in July ‘18 from (162) in July ‘17
Aspen condo sales YTD
- Unit Sales: -16% (71) in July ‘18 from (85) in July ‘17
- Dollar Sales: +20% $210M in July ‘18 from $175M in July ‘17
- Inventory Active Listings: -19% (239) in July ‘18 from (298) in July ‘17
Aspen Single family home sales July 2018
- Unit Sales: -38% (5) in July ‘18 from (8) in July ‘17
- Dollar Sales: -44% $37M in July ‘18 from $67M in July ‘17
- Inventory Active Listings: +2% (185) in July ‘18 from (182) in July ‘17
Aspen Single family home sales YTD
- Unit Sales: -19% (50) in July ‘18 from (62) in July ‘17
- Dollar Sales: -22% $342M in July ‘18 from $439M in July ‘17
- Inventory Active Listings: -3% (266) in July ‘18 from (277) in July ‘17
* Typically, the Aspen market represents 70-75% of the total combined Aspen Snowmass Village real estate marketplace.
July 2018 Market Statistics Summary for Snowmass Village Only
Snowmass Village condo sales July 2018
- Unit Sales: +0% (4) in July ‘18 from (4) in July ‘17
- Dollar Sales: -4% $5M in July ‘18 from $5M in July ‘17
- Inventory Active Listings: +9% (174) in July ‘18 from (159) in July ‘17
Snowmass Village condo sales YTD
- Unit Sales: +27% (57) in July ‘18 from (45) in July ‘17
- Dollar Sales: +1% $48M in July ‘18 from $47M in July ‘17
- Inventory Active Listings: +16% (284) in July ‘18 from (244) in July ‘17
Snowmass Village Single family home sales July 2018
- Unit Sales: +100% (2) in July ‘18 from (1) in July ‘17
- Dollar Sales: +182% $5M in July ‘18 from $2M in July ‘17
- Inventory Active Listings: -6% (87) in July ‘18 from (93) in July ‘17
Snowmass Village Single family home sales YTD
- Unit Sales: +30% (26) in July ‘18 from (20) in July ‘17
- Dollar Sales: 5% $79M in July ‘18 from $75M in July ‘17
- Inventory Active Listings: +2% (127) in July ‘18 from (124) in July ‘17
* Typically, the Snowmass Village market represents 25-30% of the total combined Aspen Snowmass Village real estate marketplace.
Links to July 2018 Aspen and Snowmass Village Sold Property Photos and Details
Aspen July 2018 Closed Properties (11). This link is valid until 8/31/2018.
Snowmass Village July 2018 Closed Properties (6). This link is valid until 8/31/2018.
Vacant Lots July 2018 Closed Properties (2). This link is valid until 8/31/2018.


