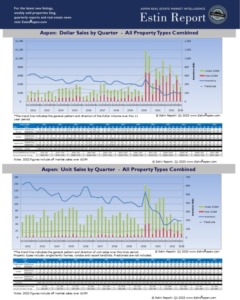
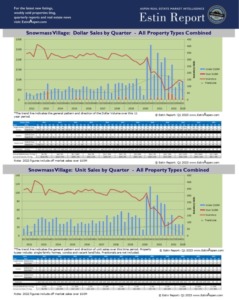
Posted in the Charts Section: There are (2) series of Aspen CO & Snowmass Village CO historic sales & inventory quarterly charts from Q1 2012 – Q3 2024.
Each 4-page series contains dollar sales, unit sales and inventory of properties for sale broken down by: 1) all property types combined; 2) single family homes; 3) condos; 4) vacant land/lots.
Aspen Real Estate Market
Historic Quarterly Charts Q1 2012 – Q3 2024
Snowmass Village Real Estate Market
Historic Quarterly Charts Q1 2012 – Q3 2024
Click images to view charts.


