Released Apr 11, 2022 v2*
There are (2) series of historic quarterly charts from 2011 – 2022:
Aspen CO and Snowmass Village CO
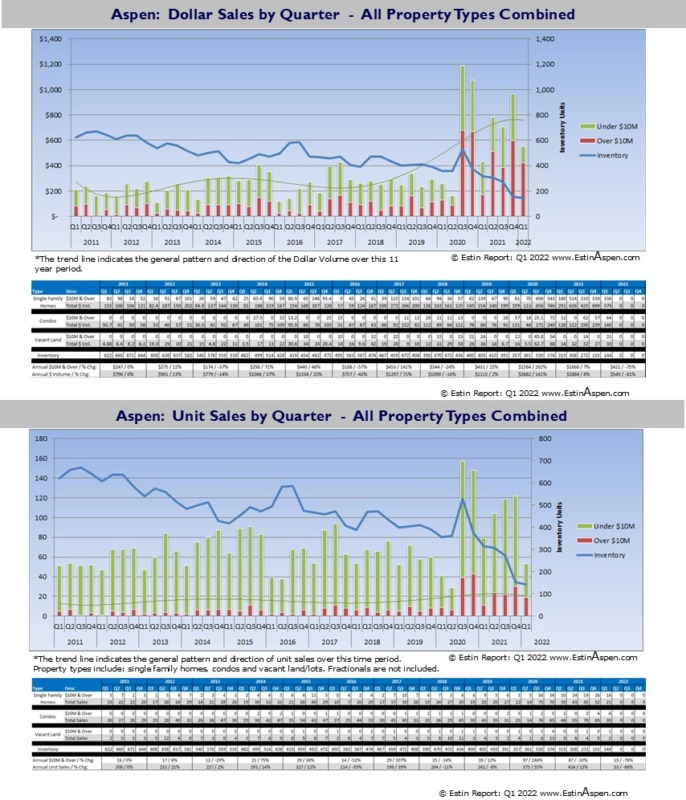
Aspen Real Estate by Quarter: Q1 2011 – Q1 2022
Aspen Historic Quarterly Sales & Inventory by Year
Charts Q1 2011 – Q1 2022 (4-Page PDF) with the following individual charts for Aspen CO:
– Aspen Total Dollar & Unit Sales and Inventory
– Aspen Single Family Home Sales & Inventory
– Aspen Condo/Townhome/Duplex Sales & Inventory
– Aspen Vacant Land Sales & Inventory
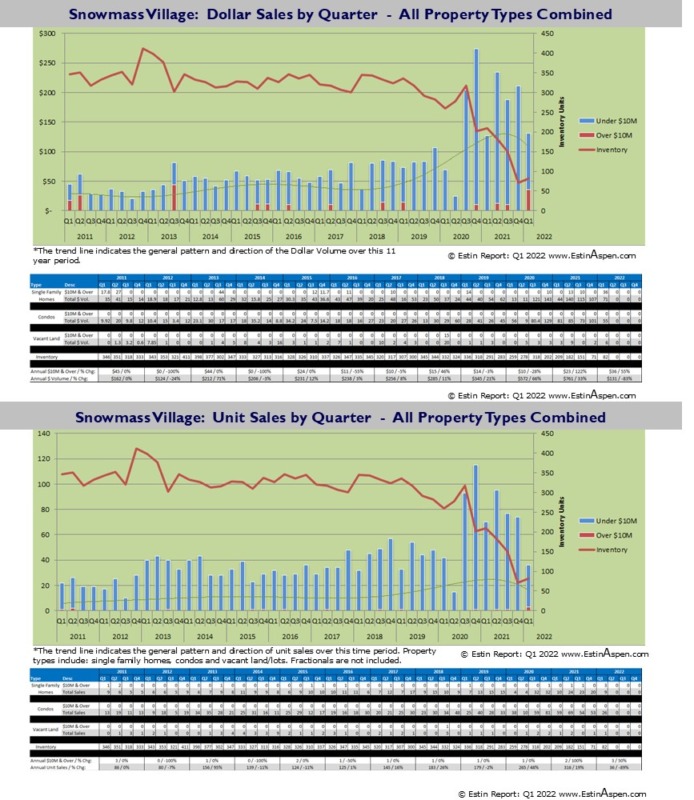
Snowmass Village Real Estate by Quarter: Q1 2011 – Q1 2022
Snowmass Village Historic Quarterly Sales & Inventory by Year
Q1 2011 – Q1 2022 (4-Page PDF) with the following individual charts for Snowmass Village CO
– Snowmass Village Total Dollar & Unit Sales and Inventory
– Snowmass Village Single Family Home Sales & Inventory
– Snowmass Village Condo/Townhome/Duplex Sales & Inventory
– Snowmass Village Vacant Land Sales & Inventory
*v2 =The right axis is for the inventory units. I have tried to make it more clear with this update.


