Jan 21 - 28, 2018 Estin Report: Last Week's Aspen Snowmass Real Estate Sales & Stats: Closed (10) + Under Contract / Pending (12)
The Dec 2017 Market Snapshot was released 01/13/17 in Current Reports.
New in Charts in Current Reports
12/23/17: Charts: 2017 Aspen Sales by Neighborhood and Property Type and Downtown Condos Fly High - new charts to be included in my year end 2017 report to be released soon.
11/20/17: Where are we now? Chart Series: 2006 – Q3 2017 Historic Pace of Aspen and Snowmass Village Dollar and Unit Sales (updated every quarter. Q4 2017 update to be updated soon).
Clients often ask, “Where are we now compared to the Great Recession…?” My interest in creating this series of charts is to answer that question for myself and to offer a visual reference for that conversation – to compare Aspen and Snowmass Village sales activity now to pre-recession mid-2000’s levels...Read more
Bottom Line Dec 2017
"Dec 2017 ended on a weak note compared to what was to an outstanding year. A disappointment in fact. But maybe this was the reprieve we needed after an exceptionally strong three months in August, Sep and Oct ’17.
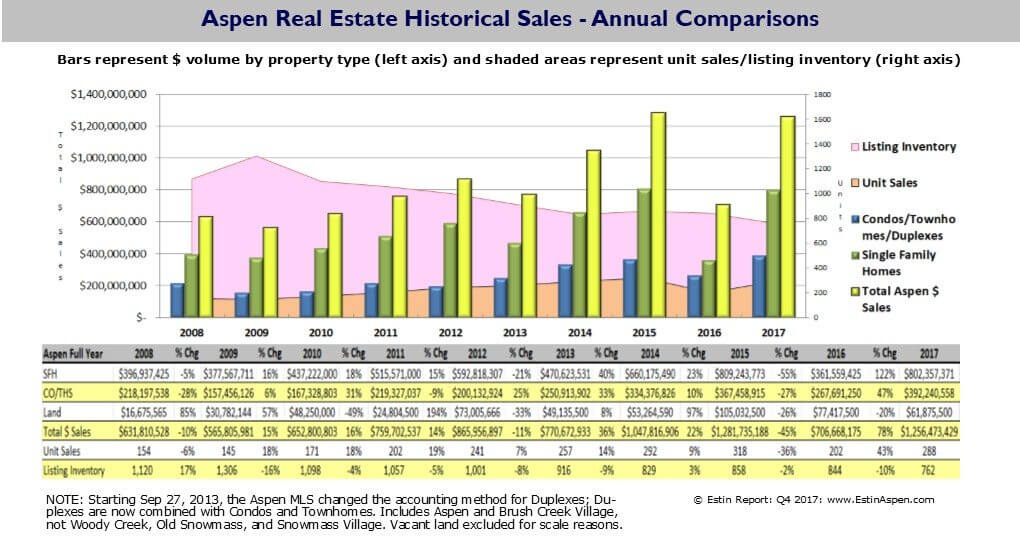
For the year, dollar sales at $1.512B were almost dead-even with $1.513B in Year 2015; unit sales were also near even with 2015 with (433) in 2017 versus (442) in 2015. Years 2017 and 2015 were remarkably similar to one another and the best performing years of the past ten, 2008-2017, while 2017 had the lowest inventory of properties for sale of that ten year period: (762) listings inventory 2017 vs (858) in 2015, -11%.
Standout categories for the month of December are:
1) Sales of properties over $10M and over at near record of 2015.
For the year 2017, dollar sales of properties $10M and above are up 181% to $442M from $157M in 2016; Unit sales are up 142% to (29) versus (12) last year.
In 2017, $10M and over property sales accounted for $442M, or 29%, of the $1.512B total market dollar sales and (29), or 7%, of the (433) total unit sales.
In 2015, sales of properties $10M and over were $454M, or 30%, of the $1.513B total market dollar sales and (30), or 7%, of the (441) total unit sales.
2) Aspen condos: Sales are up 29% YTD while inventory of available listings is down -18%. High demand and falling inventory is creating price pressure: In the 3-mos sales period from Oct-Dec 17, the avg Aspen Core condo/townhome sold at $1,514 sq ft over $1,252 in the same period Dec 2017, +21%.
3) Where are the Aspen Discounts? Checkout areas a bit farther out of town but more than compensating for the 'relative' distance are the staggering views and high mountain scenery. This is 'Rocky Mountain High' living at its best at sub-prime pricing! Giddy-up folks!! For example, Starwood had (2) sales in the three months of Oct-Dec 17 at an avg $624 sq ft vs $616 sq ft same period a year ago, +1%. The caveat: these sales were for older homes selling essentially at lot value, but for reference, compare this to the avg. (3) downtown SF home sales +31%, $2,227 sq ft in Oct-Dec 2017 vs $1,704 sq ft in the same period last year. Another example is Woody Creek where home prices over $1.5M are still relatively discounted at $1,310 sq ft in Oct-Dec 2017 versus $963 sq ft same time last year. +36%. See Best Deals for Starwood/McLain Flats and Woody Creek properties.
4) Snowmass Village values: SMV is entering its prime winter selling season Dec – April, and unit sales activity has been picking up similar to 2015. The revived Snowmass Base Village under new ownership is completing some major construction projects and the base area if starting to look and feel more finished than the construction site its been for the past 10 years. There is a lot of excitement and positive energy while at the same time, SMV opportunities continue…in general, prices – at 40-60% discount-to-Aspen – are similar, if not down incrementally, from last year... Read More

