Released 12.26.14. These are 2014 Year-to-Date stats through Dec 22, 2014 – with charts and tables below for the Aspen and Snowmass Village real estate market at year end. The full 4th Quarter and Year 2014 report will be released mid Jan. 2015. The Estin Report: Aspen Snowmass Real Estate Market documents sales and market activity in the upper Roaring Fork Valley – Aspen, Snowmass Village, Woody Creek (WC) and Old Snowmass (OSM). Included property types are single family homes, condos, townhomes, duplexes and residential vacant land at sold at prices over $250,000. Fractionals are not included. Aspen* includes WC and OSM.
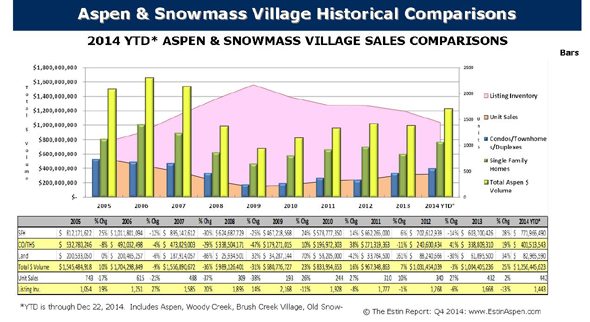
Total Aspen and Snowmass Village Market Combined Though Dec 22, 2014
- Unit Sales: up 5%, from 432 sales in 2013 to 453 sales in 2014
- Dollar Sales: up 28%, from $1,005M in 2013 to $1,282M in 2014.
- Inventory: Down 13%, from 1,668 properties for sale in 2013 to 1,443 in 2014.
Click Chart to enlarge
Click table to enlarge
_________________
The Aspen real estate market is about to complete its best year since 2007. Along with positive economic news across the country, a strong and confident Aspen market has returned.
Total Aspen and Snowmass Village Market Combined
- Unit Sales: up 5%, from 432 sales in 2013 to 453 sales in 2014
- Dollar Sales: up 28%, from $1,005M in 2013 to $1,282M in 2014.
- Inventory: Down 13%, from 1,668 properties for sale in 2013 to 1,443 in 2014.
Click Chart to enlarge
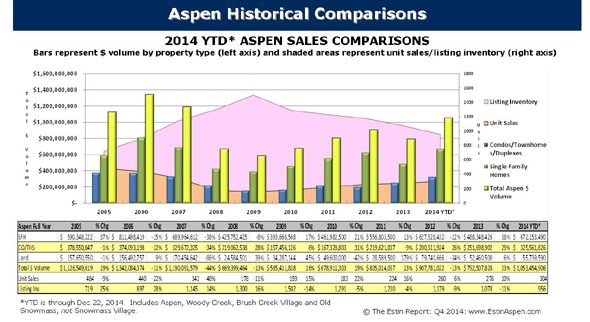
Aspen Market (includes SFH, Condos, Vacant Land sales and areas Aspen, Brush Creek, Woody Cr and Old Snowmass)
- Unit Sales = up 14%, from 276 sales in 2013 to 315 sales in 2014
- Dollar Sales = up 36%, from $793M in 2013 to $1,079M in 2014.
- Listing Inventory = down 11%, from 1,078 properties for sale in 2013 to 956 in 2014
Click charts/tables to enlarge
Click charts/tables to enlarge
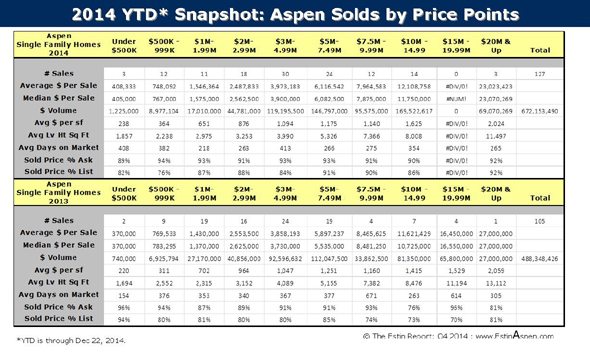
Aspen Single Family Homes (SFH):
- Sales Priced $7.5M – $9.99M = up 67% from 4 in 2013 to 12 in 2014YTD
- Sales Priced $10M – $14.99M = up 50% from 7 in 2013 to 14 in 2014 YTD
- Sales Priced $20M+ = up 200% from 1 sale in 2013 to 3 sales in 2014YTD
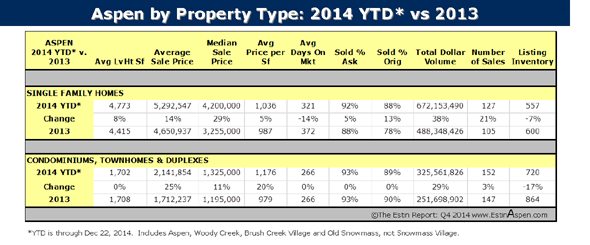
- Unit Sales = up 21%, from 105 sales in 2013 to 127 sales in 2014
- Dollar Sales = up 38%, from $488M in 2013 to $672M in 2014.
- Listing Inventory = down 7%, from 600 properties for sale in 2013 to 557 in 2014
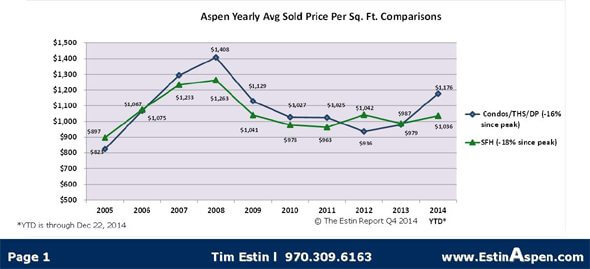
- Avg $/Sq Ft = up 5% from $987 sq ft in 2013 to 1,026
- Median Sold Price = up 29%, from $3.25M in 2013 to $4.2M in 2014YTD
- Avg Sold Price = up 14% from $4.65M in 2013 to $5.3M in 2014 YTD
- Unit Sales = up 21% from 105 units in 2031 to 125 units in 2014 YTD
- Sold Price % of Ask Price = up 5% from 88% in 2013 to 92% in 2014 YTD
- Sold Price % of Original List = up 13% from 78% in 2013 to 88% in 2014 YTD
- Of note: Jan 2015 Scheduled Closings: There are (3) properties over $10M scheduled to close in early Jan 2015 with ask prices of $24.5M, $17.8M and $12.9M
Aspen Condominiums
- Unit Sales = up 3% from 147 sales in 2013 to 152 sales in 2014
- Dollar Sales = up 29% from $252M in 2013 to $326M in 2014.
- Listing Inventory = down 17% from 864 properties for sale in 2013 to 720 in 2014
- Avg $/Sq Ft = up 20% from $979 sq ft in 2013 to $1,176 in 2014 YTD
- Median Sold Price = up 11% from $1.2M in 2013 to $1.325M in 2014YTD
- Avg Sold Price = up 25% from $1.7M in 2013 to $2.1M in 2014 YTD
- Sold Price % of Ask Price = unchanged 0% from 93% in 2013 to 93% in 2014 YTD
- Sold Price % of Original List = unchanged 0% from 90% in 2013 to 89% in 2014 YTD
Aspen Under Contracts scheduled to close by Dec 31, 2014
Click charts/tables to enlarge
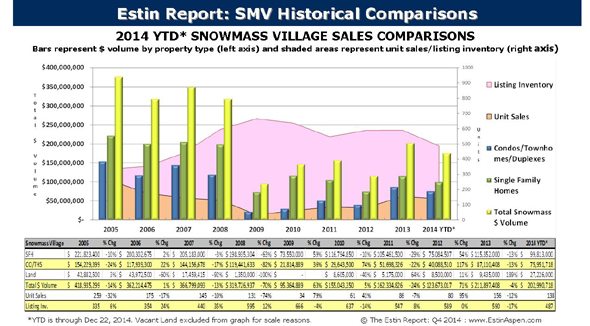
Snowmass Village Market (includes SFH, Condos andVacant Land sales)
- Unit Sales: down 12% from 156 sales in 2013 to 138 sales in 2014
- Dollar Sales: down 4% from $212M in 2013 to $203M in 2014.
- Listing Inventory: down 17% from 590 properties for sale in 2013 to 487 in 2014.
Click charts/tables to enlarge
Click charts/tables to enlarge.
Click charts/tables to enlarge.
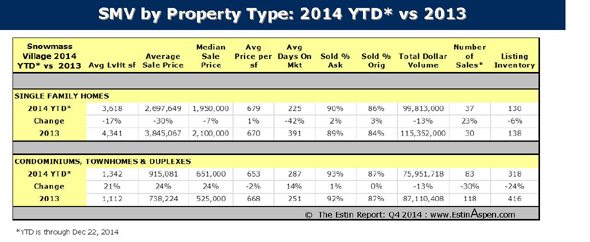
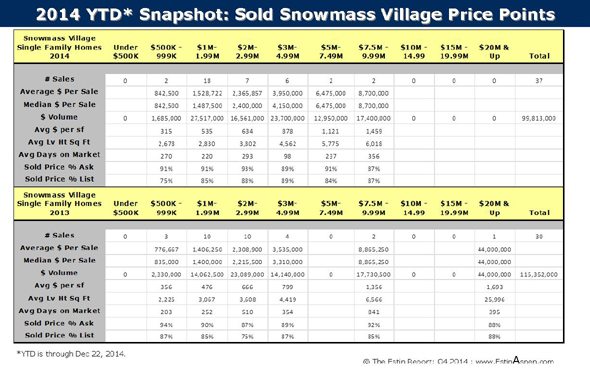
Snowmass Single Family Homes
- Unit Sales = up 23% from 30 units in 2013 to 37 units in 2014 YTD
- Dollar Sales = down 13% from $115M in 2013 to $100M in 2014 YTD
- Listing Inventory = down 6% from 138 in 2013 to 130 in 2014 YTD
- Avg $/Sq Ft = up 1% from $670 sq ft in 2013 to $671 in 2014 YTD
- Median Sold Price = down 7%, from $2.1M in 2013 to $1.95M in 2014YTD
- Avg Sold Price = down 30% from $3.8M in 2013 to $2.7M in 2014 YTD
- Sold Price % of Ask Price = up 5% from 88% in 2013 to 92% in 2014 YTD
- Sold Price % of Original List = up 13% from 78% in 2013 to 88% in 2014 YTD
- Unit Sales = down 30% from 118 units in 2013 to 83 units in 2014 YTD
- Dollar Sales = down 13% from $87M in 2013 to $76M in 2014 YTD
- Listing Inventory = down 24% from 416 in 2013 to 318 in 2014 YTD
- Avg $/Sq Ft = down 2%% from $668 sq ft in 2013 to $653 in 2014 YTD
- Median Sold Price = up 24%, from $525K in 2013 to $651K in 2014YTD
- Avg Sold Price = uo 24% from $738K in 2013 to $951K in 2014 YTD
- Sold Price % of Ask Price = up 1% from 92% in 2013 to 93% in 2014 YTD
- Sold Price % of Original List = unchanged 0% from 87% in 2013 to 87% in 2014 YTD
Disclaimer: The statements made in The Estin Report and on Aspen broker Tim Estin’s blog represent the opinions of the author and should not be relied upon exclusively to make real estate decisions. A potential buyer and/or seller is advised to make an independent investigation of the market and of each property before deciding to purchase or to sell. To the extent the statements made herein report facts or conclusions taken from other sources, the information is believed by the author to be reliable, however, the author makes no guarantee concerning the accuracy of the facts and conclusions reported herein. Information concerning particular real estate opportunities can be requested from Tim Estin at 970.309.6163 or email. The Estin Report is copyrighted 2014 and all rights reserved. Use is permitted subject to the following attribution with an active link to the source: “The Estin Report on Aspen real estate.”
____________________________

